••
Understanding the 50/30/20 Budgeting Rule for Effective Finance
The 50/30/20 rule is the most widely cited budgeting framework in personal finance. Here is what it actually says, where it works, where it breaks down in 2026, and how to calibrate it to your real income and costs.
Share Article:
The 50/30/20 rule has survived for two decades because it asks almost nothing of you. Three numbers, three buckets, no spreadsheet required. In a personal finance world crowded with zero-based budgeting apps, envelope systems, and 40-line spreadsheets, that simplicity is the entire pitch.
But simplicity and accuracy are not the same thing. In 2026, with housing costs elevated across most major U.S. metros and the personal savings rate sitting near historic lows, the rule's 50% needs ceiling is under more pressure than at any point since Elizabeth Warren and Amelia Warren Tyagi published it. This article explains what the rule actually says, where the math holds up, where it breaks, and how to calibrate it without abandoning it.
Where the 50/30/20 Rule Came From
The framework traces to "All Your Worth: The Ultimate Lifetime Money Plan," a 2005 book by Elizabeth Warren and her daughter Amelia Warren Tyagi. Warren was a Harvard Law professor and bankruptcy expert at the time. she is now a U.S. Senator from Massachusetts. The book grew out of their research into why middle-class families were going broke even as household incomes rose. Their conclusion: families lacked a clear sense of what they could afford to spend. The 50/30/20 rule was the fix.
The rule applies to after-tax income, what actually hits your bank account after federal, state, and payroll taxes. Not gross salary. That distinction matters more than most people realize, because pre-tax 401(k) contributions and health insurance premiums reduce take-home pay before the percentages are applied.
What Each Bucket Actually Covers
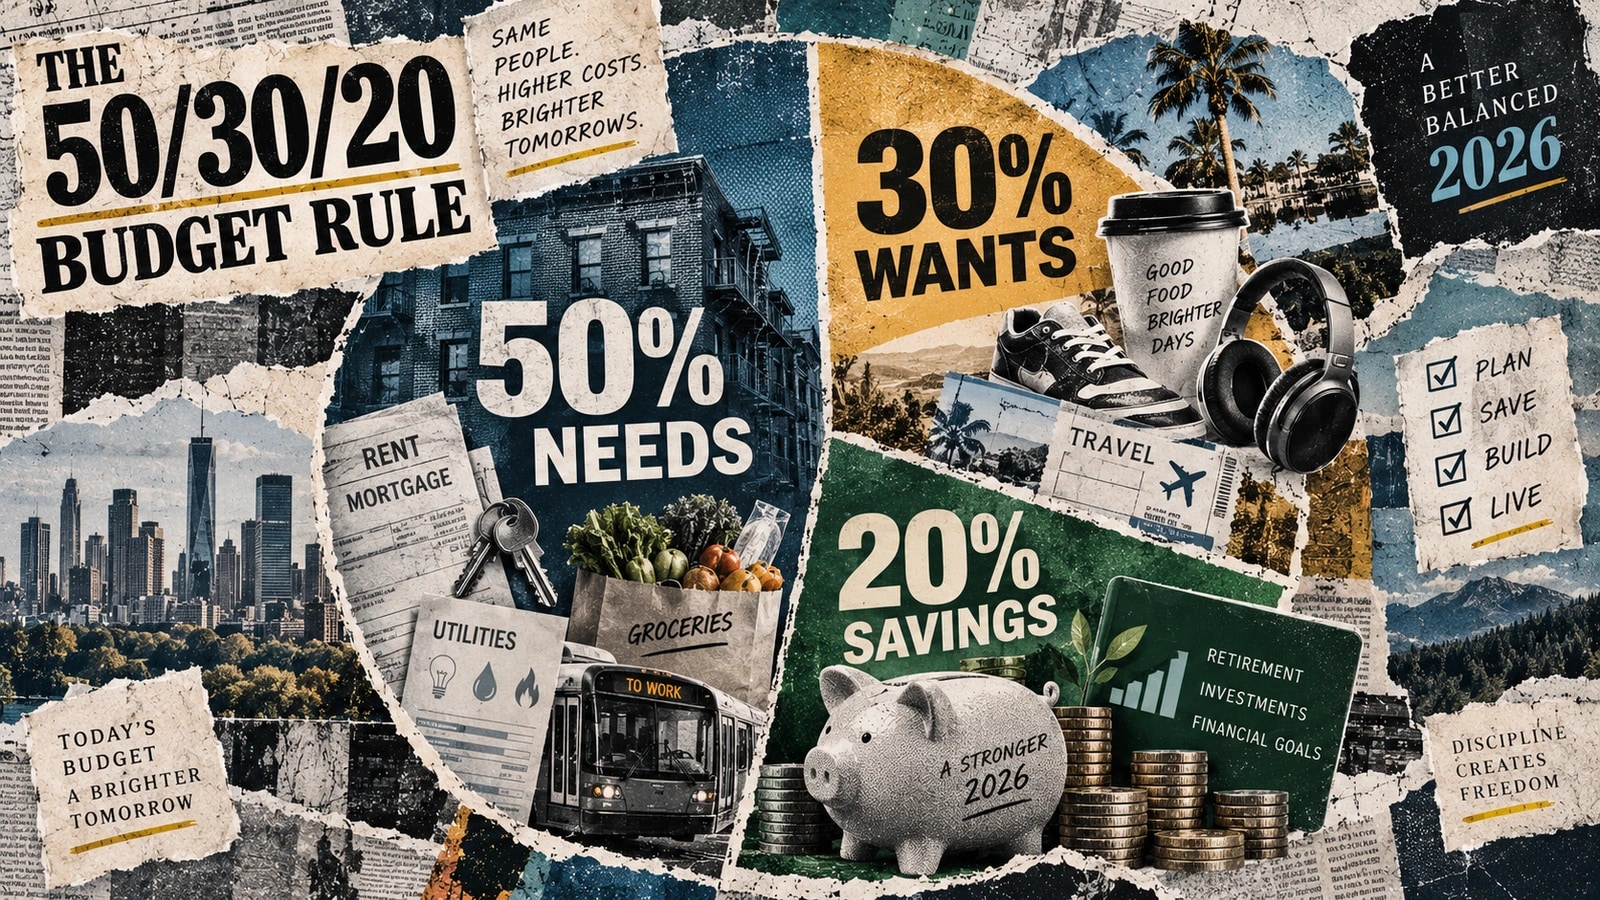
50% for Needs
Needs are expenses you cannot avoid without real consequences. Rent or mortgage, utilities, groceries, transportation required for work, minimum debt payments, health insurance premiums, and childcare all qualify. The test is simple: if skipping it would lead to eviction, a credit hit, a missed prescription, or losing your job, it belongs here.
One nuance that trips people up: only the minimum payment on a debt counts as a need. Anything you pay above the minimum is accelerated debt payoff, and that belongs in the 20% bucket.
30% for Wants
Wants are discretionary. Dining out, streaming subscriptions, travel, hobbies, gym memberships, and shopping beyond basics all fit here. The rule assigns this bucket a full 30%, which surprises people who assume frugality means shrinking wants to zero. Warren and Tyagi were explicit about this: a budget with no room for enjoyment does not last. The 30% is what makes the system sustainable.
20% for Savings and Debt Repayment
The final bucket covers emergency fund contributions, retirement account contributions, and extra payments above minimums on credit cards or student loans. This is the bucket most people skip when money gets tight, which is precisely why the framework gives it a dedicated percentage rather than leaving it to whatever is left over.
The Math in Practice
A household with USD 5,500 in monthly take-home pay would allocate:
| CategoryPercentageMonthly Amount | ||
|---|---|---|
| Needs | 50% | USD 2,750 |
| Wants | 30% | USD 1,650 |
| Savings & Debt | 20% | USD 1,100 |
That USD 1,100 breaks down further into retirement contributions, emergency fund savings, and accelerated debt payoff. The exact split within that bucket depends on your priorities, but the total stays at 20%.
Where the Rule Breaks Down in 2026
Housing Alone Can Consume the Entire Needs Bucket
The most serious criticism of the 50/30/20 rule is that its 50% needs ceiling was calibrated against a cost structure that no longer exists. The U.S. Department of Housing and Urban Development defines households spending more than 30% of gross income on housing as "cost-burdened." When a single line item approaches or exceeds the framework's entire needs allocation, groceries, utilities, transportation, and insurance have almost no room to fit.
The data supports this concern. According to the Bureau of Labor Statistics, housing and transportation together accounted for over 50% of total household spending in 2024. Housing averaged USD 26,266 per year, or 33.4% of total spending. Transportation added another 17.0%. Food accounted for 12.9%. By the time you add healthcare, insurance, and childcare, many households have spent well past 50% of their income before any discretionary spending occurs.
Steve Sexton, CEO of Sexton Advisory Group, told MoneyLion that in the first quarter of 2026, a median-income family buying a median-priced home would have needed about 32% of its income just for the mortgage payment. Once groceries, utilities, transportation, insurance, and healthcare are added, Sexton said "many families have spent well past 50% of their income" before spending anything on wants.
The Savings Rate Is Far Below 20%
The rule prescribes a 20% savings rate. The reality is different. Fidelity's Q2 2026 Retirement Analysis reported that the average 401(k) savings rate reached a record 14.4%, still below Fidelity's own recommended 15% benchmark. The personal savings rate fell from 6.2% in early 2024 to 3.7% in early 2026.
Meanwhile, emergency savings are thin. A 2026 Bankrate survey found that just 47% of Americans have sufficient liquidity to cover a USD 1,000 emergency expense. A separate SecureSave survey found that 55% of U.S. employees lack the ability to pay an unforeseen USD 500 expense from their own funds, and 26% have no emergency fund at all.
These numbers do not mean the 50/30/20 rule is wrong. They mean that for a large share of households, the rule is aspirational rather than descriptive.
Irregular Income Does Not Fit the Framework
Freelancers, gig workers, commission-based salespeople, and small business owners face a structural mismatch with the 50/30/20 rule. The framework assumes a stable monthly paycheck that can be divided into fixed percentages. When income varies by 40% from month to month, percentage-based budgeting becomes an exercise in constant recalculation. A base-plus-bonus approach, where fixed expenses are covered by the base income and percentages are applied only to variable income above that base, tends to work better.
Alternatives and Adjustments
60/30/10: A Better Fit for High-Cost Cities
The 60/30/10 method allocates 60% to needs, 30% to wants, and 10% to savings or debt payoff. It preserves the wants bucket while acknowledging that housing costs in places like New York, San Jose, and London can push needs above 50%. Andrew Harris, managing director at Jenius Bank, told Kiplinger that 60/30/10 offers "a flexible alternative to the traditional 50/30/20 rule" that may suit many consumers better in today's inflated economy.
The tradeoff is obvious: a 10% savings rate is half the 50/30/20 target. Harris noted that because 15% of pre-tax earnings is widely recommended for retirement, "the 10% goal isn't far off," especially for younger workers who can increase contributions as income rises.
70/20/10: Simplicity With a Lower Savings Bar
The 70/20/10 rule allocates 70% to living expenses (both needs and some wants), 20% to savings, and 10% to debt or giving. It simplifies the needs-wants distinction by collapsing them into one category, but it saves less. Credit unions and some financial planners promote it for people who find three-way categorization overwhelming.
60/20/20: Protecting the Savings Rate
A middle path increasingly recommended by planners is 60/20/20: 60% needs, 20% wants, 20% savings. It preserves the 20% savings target, which is the part of the framework most directly tied to long-term outcomes, while accepting that needs may exceed half of income in many markets. The Siebert financial blog noted that the key variable to protect is the savings percentage, not the needs-versus-wants ratio.
How to Make the 50/30/20 Rule Work for Your Actual Life
Anchor Savings First, Then Divide the Rest
The most practical adjustment is to work backward from the savings target. Decide what percentage you can realistically save, automate that contribution on payday, and then divide what remains between needs and wants. This approach acknowledges that the needs-versus-wants split varies more than the original framework implies.
Use a Calculator Instead of a Spreadsheet
The fastest way to see how the percentages apply to your income is to run the numbers. MoneyAllotment's 50/30/20 Budget Calculator lets you enter your monthly take-home pay and see the dollar amounts for each bucket instantly, with preset adjustments for high-cost-of-living areas and customizable percentages if you want to try a 60/20/20 or 70/20/10 split.
Treat the Percentages as a Starting Point, Not a Verdict
The 50/30/20 rule has lasted two decades because it gives people a place to start. It is not a law of personal finance. A household in rural Ohio with a paid-off mortgage will have a very different needs ratio than a renter in San Francisco. The framework is useful when it prompts those households to ask better questions about where their money goes, and harmful when it makes them feel like failures for not hitting numbers that were never calibrated to their circumstances.
Disclaimer: This article is for informational and educational purposes only and is not personalized financial, investment, or legal advice. Consult a licensed professional for advice specific to your situation.
Sources
- Acorns — What Is the 50/30/20 Rule? A Simple Budget Method Explained
- Bureau of Labor Statistics — Housing and transportation accounted for 50 percent of household spending in 2024
- MoneyLion — This Budgeting Rule Worked in 2015 — 3 Experts Say It Falls Short Today
- Siebert — The 50/30/20 Rule: Smart Budgeting or Outdated Advice?
- Kiplinger — The New 60/30/10 Budgeting Method
- Bankrate — 2026 Emergency Savings Report
Frequently Asked Questions
What is the 50/30/20 budgeting rule?
The 50/30/20 budgeting rule divides after-tax income into three categories: 50% for needs, 30% for wants, and 20% for savings and debt repayment. It serves as a foundational framework for personal finance management.
How can I adjust the 50/30/20 rule for rising costs?
In response to increasing housing and living expenses, you might consider adjusting the rule to 60/20/20 or 60/30/10. These modifications provide more flexibility while still prioritizing savings.
Who created the 50/30/20 rule?
The 50/30/20 rule was introduced in the book 'All Your Worth: The Ultimate Lifetime Money Plan' by Elizabeth Warren and Amelia Warren Tyagi, published in 2005. Elizabeth Warren is a U.S. Senator and former Harvard Law professor.
Is the 50/30/20 rule still effective in 2026?
While the 50/30/20 rule remains popular, its effectiveness may be challenged in 2026 due to rising housing costs and low personal savings rates. Adjustments may be necessary to accommodate current economic conditions.
From the Desk
All Personal Finance →More in Personal Finance

Surge in Student Loan Defaults: Key Insights for Borrowers
Federal student loan defaults surged to 3.6 million in six months as pandemic-era protections ended. Here's what's driving the wave and how borrowers can still recover.

Fresh Reporting
Browse All Stories →Latest from The Ledger

Bitcoin Recovery: From $58,000 to $80,000 in September 2026
Bitcoin recovery saw a rise from USD 58,000 to USD 80,000 by mid-September 2026, driven by a short squeeze and ETF inflows. What lies ahead?



Leave a Comment
Your email address will not be published. Required fields are marked *